OSC Monitor
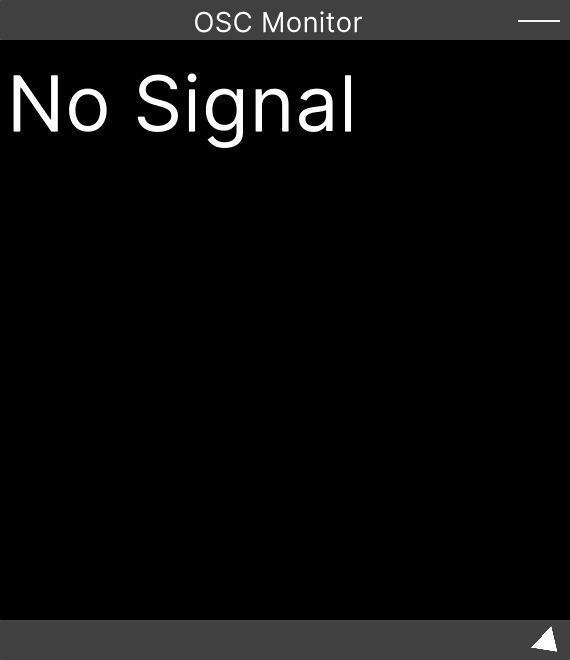
A window that lists received OSC messages exactly as they arrive. Use it to check on the spot whether OSC is really reaching SynapseRack from the outside, and whether the addresses and types are what you expect.
Opening it
Menu bar: Window → OSCMonitor. This window exists from startup, so this brings it back to the center of the screen. It cannot be closed.
How it is displayed
One line is one message, formatted as follows.
/address: value type:typeThe type is one of int / float / string / bool / byte[].
When a single message contains several values, they are listed one after another on the same line.
- The newest message appears at the top
- The last 30 messages are kept, and older ones drop off
- While nothing is being received,
No Signalis displayed
Only received (Input) messages appear here. OSC sent from SynapseRack is not shown.
There is no way to pause, clear or filter the log. There are no clear, filter, pause or copy buttons, and it does not scroll. Anything beyond 30 entries simply flows off the end.
Setting the receive port
The port is not set in this window but under Setting → GlobalSettings → OSC in the menu bar.
| Setting | Default |
|---|---|
| OSC Input | Disabled (off on first launch) |
| Input Port | 3170 |
| OSC Output | Disabled (off on first launch) |
| Output Address | 127.0.0.1 |
| Output Port | 3171 |
These settings are saved as machine settings rather than with the project, so the ports do not change when you open a different project.
Related
- OSC input and output — the actual procedure for driving parameters over OSC